₹19,380.00
CERTIFICATE IN TABLEAU
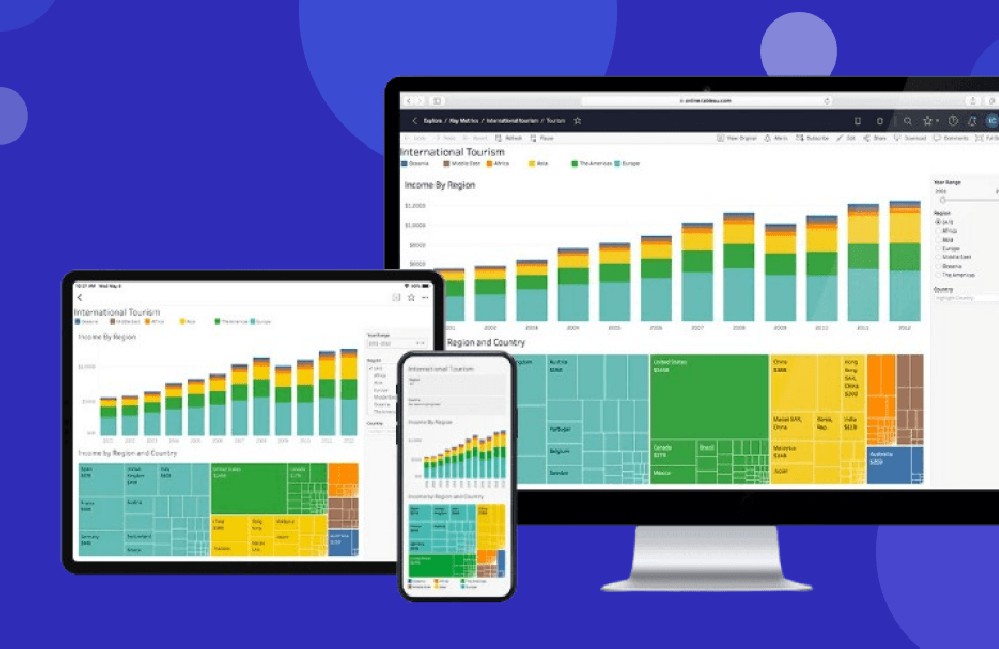
Master the art of data visualization and analytics with Tableau! This hands-on course equips you with the skills to transform raw data into actionable insights, create interactive dashboards, and tell compelling data stories. Whether you're a beginner or looking to advance your skills, this course will prepare you for real-world data analysis challenges.
What Will You Learn?
- Create Interactive Dashboards: Design and publish dynamic dashboards for effective data visualization.
- Analyze Data with Ease: Use Tableau to explore, clean, and analyze complex datasets.
- Master Advanced Features: Learn advanced techniques like calculated fields, parameters, and storytelling.
- Integrate Data Sources: Connect Tableau to various data sources (Excel, SQL, Cloud) for seamless analysis.
- Tell Data-Driven Stories: Use Tableau’s storytelling tools to present insights in a compelling way.
- Prepare for Tableau Certification: Gain the skills and confidence to pass the Tableau Desktop Specialist or Certified Associate exam.
This course is designed to empower you with the knowledge and hands-on experience needed to become a proficient Tableau user. You’ll learn how to:
- Transform raw data into meaningful visualizations.
- Use Tableau’s drag-and-drop interface to create charts, graphs, and maps.
- Apply best practices for data visualization and dashboard design.
- Solve real-world business problems using Tableau.
- Build a portfolio of Tableau projects to showcase your skills to employers.
Lessons Of Course
MODULE No. 1 |
05H |
Introduction to Tableau
Advantages of Tableau
Disadvantages of Tableau
MODULE No. 2 |
05H |
Overview of the Tableau Interface
Creating a Workbook
Selecting Data Connector
Connecting to Different Data Sources (Excel, SQL, Cloud, etc.)
Creating SQL Queries
Creating Worksheets
MODULE No. 3 |
10H |
Introduction to charts and visuals
Understanding Data Types in Tableau
Area Charts
Bar Charts
Line Charts
Pie Charts
Crosstabs
Scatter Plot
Box Plot
Histogram
Dual-Axis & Combination Charts
Bullet Graphs
Treemaps & Heatmaps
Waterfall & Gantt Charts
Highlight Tables
MODULE No. 4 |
10H |
Creating Calculated Fields
Combining Fields
Finding a Sequence inside a String
Assigning Categories for Value Ranges
Calculating Percent Change
Using Table Calculations
LOD (Level of Detail) Expressions (Fixed, Include, Exclude)
MODULE No. 5 |
05H |
Data Formatting & Advanced
Specifying Number Formats
Advanced Analytics Functions
Segmentation & Cohort Analytics in Tableau
Clustering
Using Sets & Set Actions
Grouping Data
Using Parameters for Dynamic Analysis
MODULE No. 6 |
10H |
Order of Operations in Tableau
Filtering Headers
Dragging Dimensions, Measures, and Dates to Filters Shelf
Filtering Categorical Data (Dimensions)
Filtering Quantitative Data (Measures)
Filtering Dates
Filtering Table Calculations
Showing a Filter in the View
Customizing Filter Cards
Filter Card Modes
Setting Options for Filter Interaction & Appearance
Sorting Data in Tableau (Manual, Nested, Computed, etc.)
MODULE No. 7 |
10H |
Creating a Dashboard
Adding Interactivity to Dashboards
Adding Dashboard Objects & Setting Options
Copying Objects
Using Image Objects
Using Navigation & Download Objects
Showing and Hiding Objects
Security Options for Web Page Objects
Story Line & Storytelling Concepts
Creating Story Points
Layout Options
Fitting a Dashboard to a Story
Formatting a Story
Clearing Story Formats
Deleting a Story Point
Presenting a Story
MODULE No. 8 |
05H |
Steps to Publish a Workbook
Setting Permissions for Users
Managing Data Sources
Publishing Options
Exporting & Sharing Visualizations
Embedding Tableau Dashboards in Websites or Reports


